Machine learning recommendations in Incentivio help increase order revenue by delivering smarter, more personalized item suggestions to guests. Our new recommendations model intelligently analyzes what a guest has in their cart, past purchase behavior, and recent ordering trends to recommend complementary items like drinks, sides, or desserts, at the perfect moment. By surfacing relevant add-ons in real time, restaurants can drive higher average check values while creating a more seamless and tailored ordering experience. This guide walks through how to analyze your recommendation's performance.
To manage recommendations, please see Dashboard - Managing Recommendations
Summary Metrics
The Summary section provides a quick snapshot of how recommendations are performing over the selected date range.
% of Orders that Displayed a Recommendation
Shows how often recommendations appeared during checkout. A higher percentage means recommendations are consistently being surfaced to guests.
Orders with Purchased Recommendation
The number of orders where at least one recommended item was added to the cart. This helps measure guest engagement with recommendations.
% of Transactions where a Recommendation was Purchased
Indicates conversion rate: how often recommendations led to an actual purchase.
% of Revenue Lift for Orders with a Purchased Recommendation
Shows the average increase in order value when guests purchase a recommended item compared to orders without one.
Total Revenue Added through Recommendations
Revenue generated directly from recommended items being purchased.
Revenue Added after Showing Recommendations
Represents additional revenue associated with orders where recommendations were shown, helping illustrate overall impact beyond direct item sales.
Detailed Metrics
Filters & Controls
Use the filters to refine what you’re viewing:
Date Range – Adjust the timeframe to analyze performance trends.
Locations – View results across all locations or focus on specific stores.
Refresh – Update the report with the latest available data.
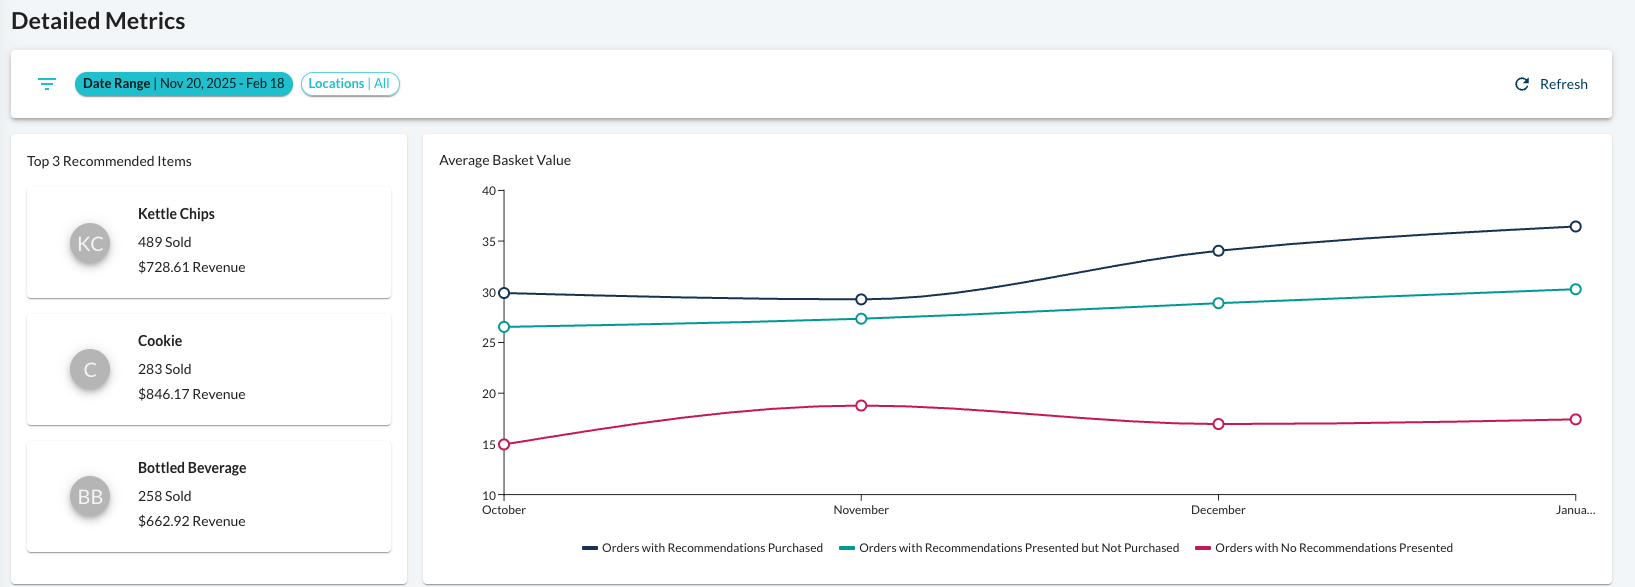
Top Recommended Items
This section highlights the items most frequently purchased through recommendations.
Each item card shows:
Quantity sold through recommendations
Revenue generated
Relative performance compared to other items
Use this to identify:
Strong upsell performers
Items that pair well with your core menu
Opportunities to adjust overrides or categories
Average Basket Value Chart
The chart compares average order values across different scenarios:
Orders where recommendations were purchased
Orders where recommendations were shown but not purchased
Orders with no recommendations displayed
This helps you understand the true impact recommendations have on guest spend behavior.
Top 15 Recommended Items Table
This table provides a deeper breakdown of recommendation performance.
Item Name
The recommended menu item.
Quantity Sold
How many times the item was purchased through recommendations.
Orders
Number of unique orders containing the item as a recommendation.
Revenue
Total revenue generated from recommended purchases.
Take Rate
The percentage of recommendation impressions that resulted in a purchase.
Higher take rates often indicate strong item pairings or effective recommendation placement.
How to Use This Report
Use this report to:
Identify which items drive the most incremental revenue
Spot low-performing recommendations that may need adjustments
Evaluate the effectiveness of custom overrides or category rules
Understand how thew new intelligent recommendations model is influencing order behavior and basket size
Regularly reviewing this report helps ensure your recommendations stay relevant, balanced across categories, and aligned with your business goals.
Next lesson - Lesson 29: Loyalty Offers